




A good Instagram reach rate is roughly 10% to 20% of your followers per post for most accounts. Smaller accounts often reach a higher share of their audience, while large brands average around 12% for feed posts and about 2% for Stories (Hootsuite, 2026). Reach rate is the percentage of your followers who saw a post, calculated as post reach divided by total followers, times 100.
One thing to clear up first, because it trips up almost everyone: reach rate and engagement rate are not the same metric, and most "benchmarks" you find online are actually engagement numbers. This guide keeps them separate so your goalposts are right.
- Reach rate = how many unique people saw your post, as a share of followers.
- For most accounts, 10% to 20% per post is healthy; it falls as your following grows.
- Reach is not engagement. Engagement (likes, comments, saves) now averages well under 1% across all accounts.
- Your own trend matters more than any benchmark. Track it in Instagram Insights.
What is reach rate on Instagram?
Reach rate is the percentage of your audience that saw a piece of content. It answers a simple question: of all my followers, how many actually laid eyes on this post?
It is different from impressions, which count total views including repeats. If one person sees your post three times, that is three impressions but one reach. Reach counts unique people, which makes it a cleaner measure of how far your content traveled.
Reach rate = (unique viewers ÷ total followers) × 100Example: 1,000 followers and 250 unique viewers on a post gives a 25% reach rate. Strong reach often signals the algorithm is pushing your content beyond your existing followers, which is exactly what you want for growth.
For the wider picture, see our Instagram growth strategies guide.
Reach rate vs engagement rate (the difference that matters)
These two get mixed up constantly, and using the wrong benchmark will make you panic over nothing. Here is the clean split:
| Metric | Measures | Formula |
|---|---|---|
| Reach rate | Who saw your post | (unique viewers ÷ followers) × 100 |
| Engagement rate | Who interacted (like, comment, save, share) | (interactions ÷ followers) × 100 |
The numbers live on completely different scales. A healthy reach rate is in the double digits (10% to 20%), while a healthy engagement rate in 2026 is often under 1% for larger accounts. So if you read that "the median engagement rate is 0.35%" and compare it to your reach, you are comparing apples to oranges. Keep them apart.
How to calculate and track reach rate
You do not need a spreadsheet. Instagram's native Insights (available on Business and Creator accounts) reports reach per post, per Story, and per Reel. To turn it into a rate, divide reach by your follower count and multiply by 100.
Track these alongside it so the number has context:
- Reach per post, Story, and Reel (formats reach differently)
- The share of reach from non-followers, your discovery engine
- How reach trends across your last 10 to 20 posts, not one viral outlier
- Engagement on the posts that reached the most people
For a fuller metric set, see our 7 key metrics to track for Instagram growth.
Good reach rate benchmarks by account size
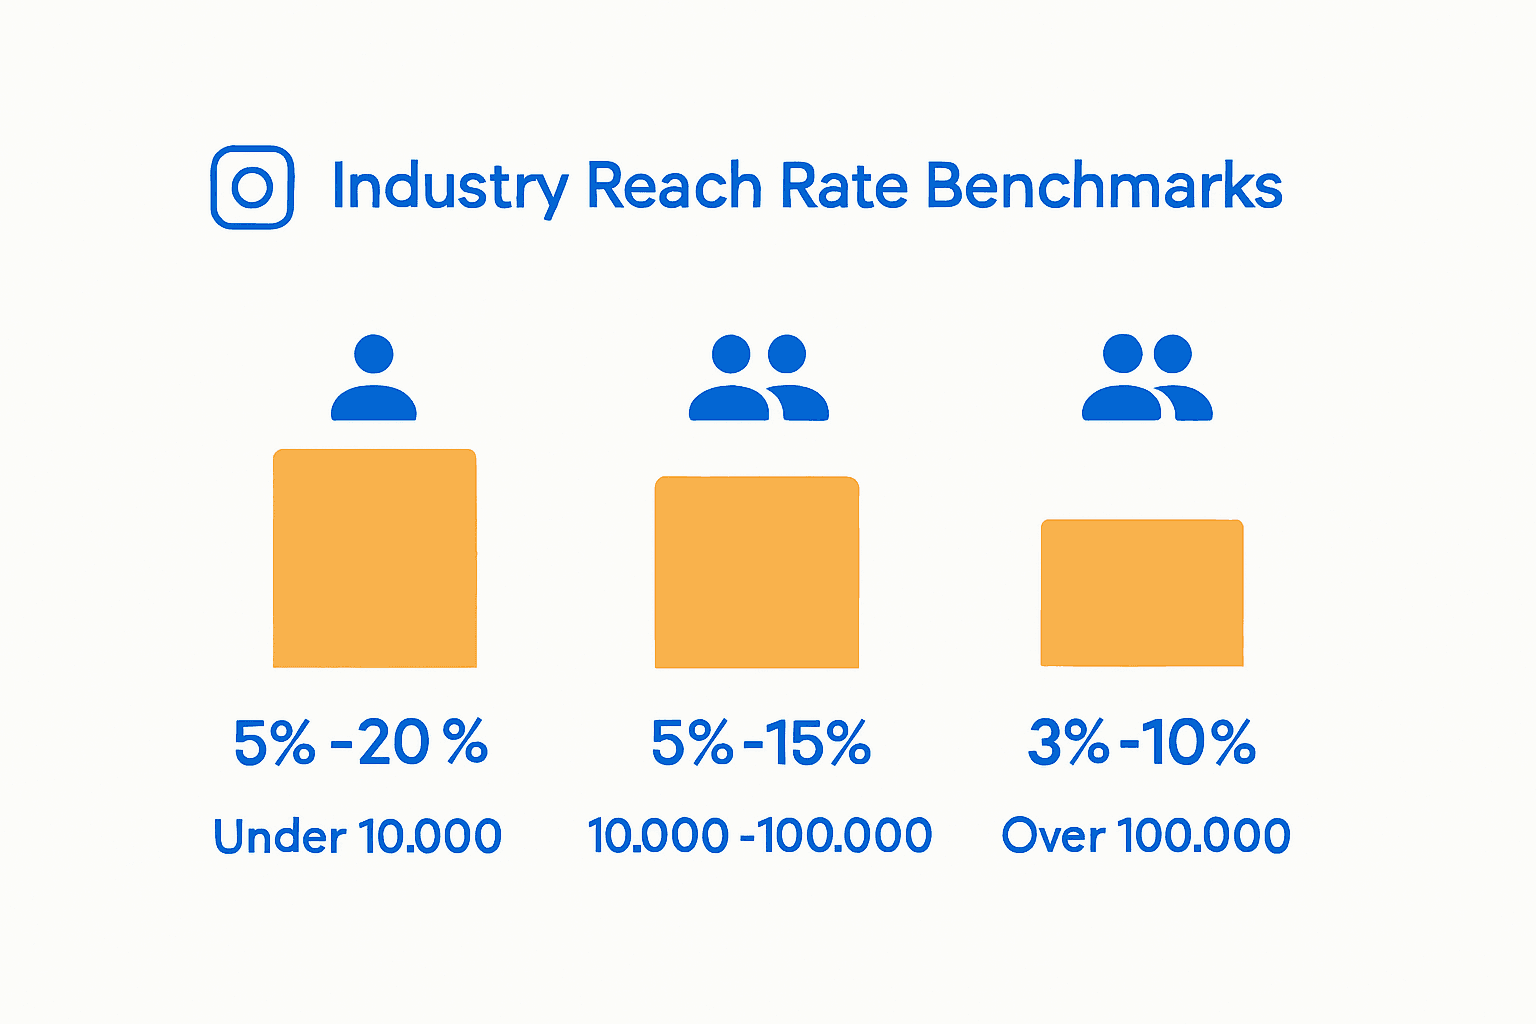
Reach rate is less standardized than engagement rate, and it drops as your following grows, simply because reaching 20% of 1,000 followers is easier than 20% of a million. Treat the ranges below as working goalposts, not hard rules.
| Account size | Typical post reach rate | Notes |
|---|---|---|
| Under 10K | ~20% or higher | Tighter audiences often see the most reach |
| 10K to 100K | ~10% to 20% | The most common creator range |
| 100K to 1M | ~8% to 15% | Reach share dilutes as you scale |
| Over 1M | ~5% to 12% | Large brands average ~12% posts, ~2% Stories |
Anchor figures from Hootsuite's 2026 Instagram metrics report (large-brand average ~12% for posts, ~2% for Stories). Smaller-account ranges reflect commonly cited social-analytics estimates; reach varies widely by niche and format, so benchmark against your own baseline.
Engagement rate benchmarks (for context)
Because the two get confused, here is the engagement side, clearly labeled. Engagement has fallen sharply: the platform median is now well under 1%, and smaller accounts consistently out-engage larger ones.
| Tier | Followers | Average engagement rate |
|---|---|---|
| Nano | 1K to 10K | ~4% to 6% |
| Micro | 10K to 100K | ~2% to 5% |
| Mid | 100K to 500K | ~1.5% to 3% |
| Mega | 1M and up | ~0.5% to 2% |
Engagement figures synthesized from Socialinsider, Rival IQ, and Dash Social 2026 benchmark reports. Overall platform median engagement sits around 0.5% to 0.7% across all accounts; Reels out-engage carousels and static posts.
Factors that influence reach
Reach is dynamic and shaped by several things working together:
- Content format: Reels reach the most non-followers, then carousels, then static posts.
- Early engagement: strong likes, comments, and saves in the first hour push the algorithm to show your post to more people.
- Posting consistency and timing: a steady rhythm at peak audience hours keeps reach stable.
- Relevance and saves: content people save and share signals quality and earns wider distribution.
- Audience activity: an engaged, real audience reaches further than a large but passive one.
For natural tactics, see our guide to increasing Instagram reach.
How to improve your reach rate
- Lead with Reels and shareable, save-worthy content.
- Earn early engagement: ask a question, prompt a comment, reply fast.
- Post consistently at the times your audience is actually online.
- Use 3 to 5 targeted, relevant hashtags rather than 20 generic ones.
- Review your last 10 to 20 posts and double down on the formats that reached furthest.
More tactics in our Instagram marketing tactics guide.
Where DM automation fits
Let's be precise, because this gets overclaimed: DM automation does not magically raise your reach rate. Reach is about content distribution, and you track it in Instagram Insights, not in a DM tool. What automation does do is influence the two things reach depends on.
- It lifts the engagement signals the algorithm rewards. A comment-to-DM call to action ("comment GUIDE and I'll send it") drives a wave of comments and replies, and that early engagement is exactly what prompts Instagram to push a post to more people.
- It converts the reach you already have. Reaching people only matters if some of them act. Automation turns reached viewers into replies, leads, and sales while interest is warm.
This is where LinktoDM helps: it automates comment-to-DM, story replies, and follow-ups on Meta's official API, so the engagement that fuels reach happens instantly instead of hours later. Use it to capitalize on reach, and keep using Instagram Insights to measure the reach itself.
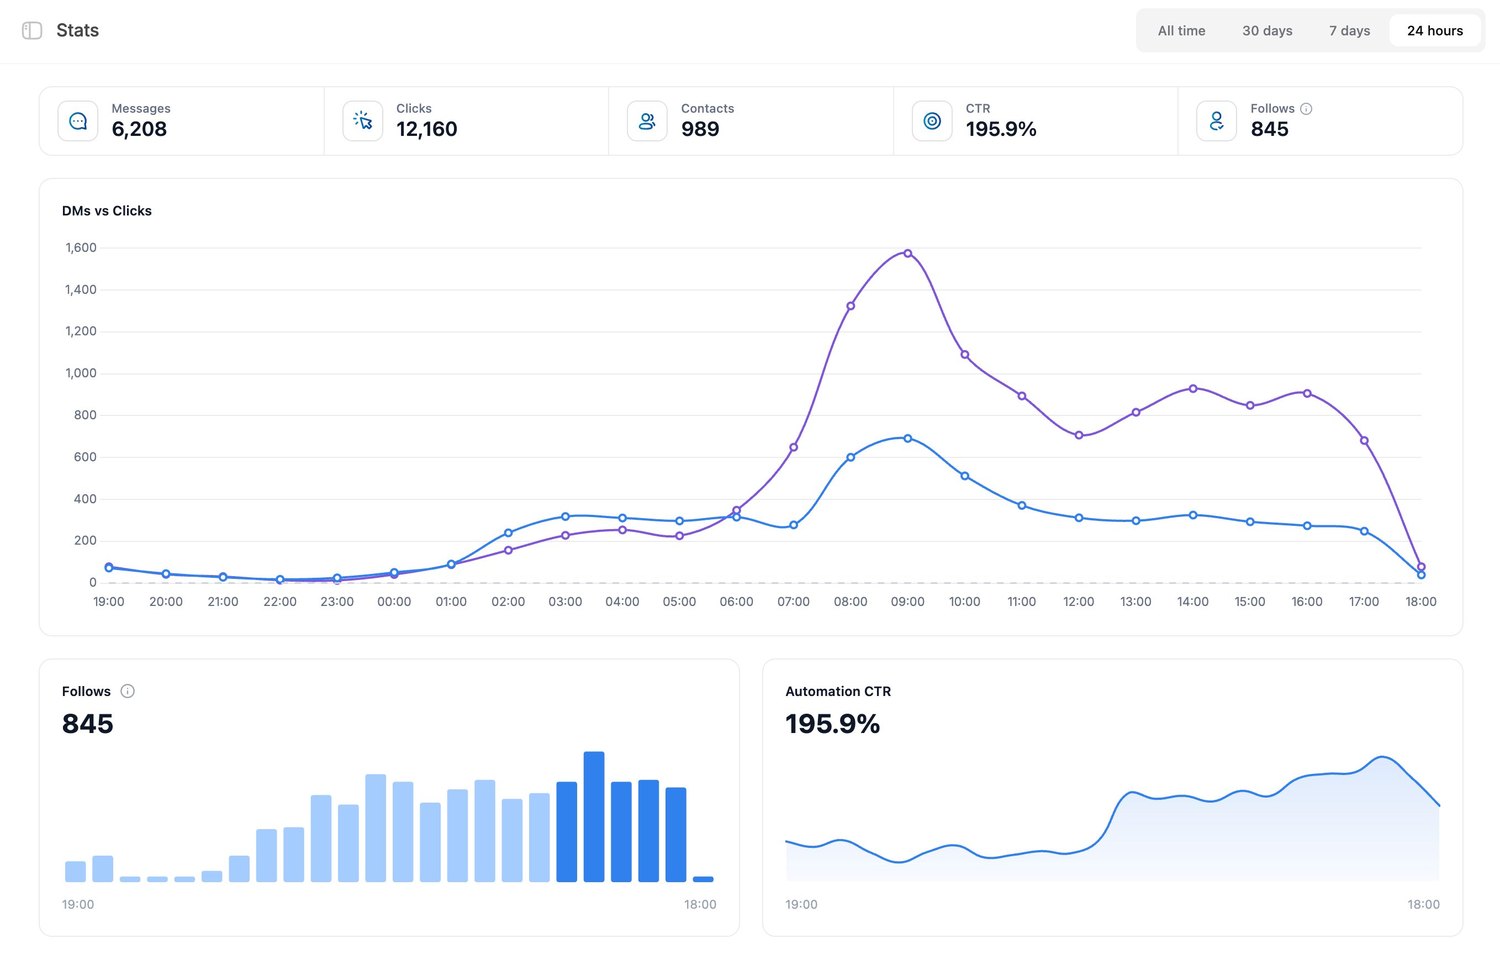
It also closes the loop on the question this guide started with. A good reach rate tells you how many people saw your post; the dashboard below shows how many of them then acted. In this 24-hour view, reach turned into 12,160 link clicks and 845 new follows, which is the real payoff of reach. High reach with no clicks or follows means the visibility is not converting, and that is the gap automation is built to close.
Frequently asked questions
What is a good reach rate on Instagram?
How is reach rate calculated?
What is the difference between reach rate and engagement rate?
Why is my Instagram reach so low?
Does reach rate fall as you gain followers?
Can DM automation improve my reach?
Related reading
- 7 key metrics to track for Instagram growth
- How to increase Instagram reach naturally
- Instagram growth strategies list
- How to get quick followers on Instagram
Disclaimer: Instagram and Meta are trademarks of their respective owners. Benchmark figures are industry estimates that change over time and vary by niche, format, and audience. Use them as directional context and rely on your own Instagram Insights for decisions.
Sources: Hootsuite Instagram metrics (2026), Rival IQ engagement benchmarks, Dash Social 2026 Instagram benchmarks, and Socialinsider 2026 benchmark data (accessed June 2026).

'%3e%3cpath%20d='M14.8156%200H1.18125C0.528125%200%200%200.515625%200%201.15313V14.8438C0%2015.4813%200.528125%2016%201.18125%2016H14.8156C15.4688%2016%2016%2015.4813%2016%2014.8469V1.15313C16%200.515625%2015.4688%200%2014.8156%200ZM4.74687%2013.6344H2.37188V5.99687H4.74687V13.6344ZM3.55938%204.95625C2.79688%204.95625%202.18125%204.34062%202.18125%203.58125C2.18125%202.82188%202.79688%202.20625%203.55938%202.20625C4.31875%202.20625%204.93437%202.82188%204.93437%203.58125C4.93437%204.3375%204.31875%204.95625%203.55938%204.95625ZM13.6344%2013.6344H11.2625V9.92188C11.2625%209.0375%2011.2469%207.89687%2010.0281%207.89687C8.79375%207.89687%208.60625%208.8625%208.60625%209.85938V13.6344H6.2375V5.99687H8.5125V7.04063H8.54375C8.85938%206.44063%209.63438%205.80625%2010.7875%205.80625C13.1906%205.80625%2013.6344%207.3875%2013.6344%209.44375V13.6344Z'%20fill='%23B1B1B1'/%3e%3c/g%3e%3cdefs%3e%3cclipPath%20id='clip0_6304_15414'%3e%3crect%20width='16'%20height='16'%20fill='white'/%3e%3c/clipPath%3e%3c/defs%3e%3c/svg%3e)

